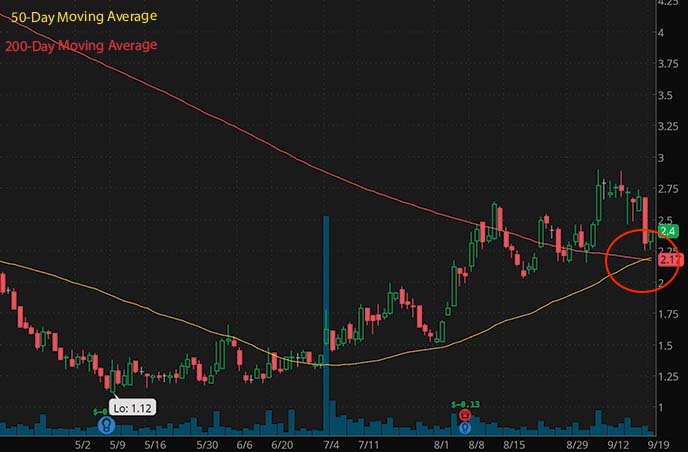
The golden cross is a term among traders and investors to refer to a particular stock chart pattern. It is known to be a bullish signal. It suggests that the stock price may be ready for an upward movement. In this article, we will explore what the golden cross is in stocks, and how it works.
What Is Technical Analysis?
Technical analysis is a method of analyzing financial markets by studying price and volume data over time. Analysts look for patterns in the data that indicate changes in investor sentiment or underlying fundamentals. These patterns are known as technical indicators. Traders use these to make predictions about what might happen next in the market.
What Is The Golden Cross?
The Golden Cross is a term used in the stock market. It is used to describe a situation in which the short-term moving average of a stock, such as the 50-day moving average, crosses above its long-term moving average, such as the 200-day moving average.
Stock market investors consider this to be a bullish signal. It indicates that the stock may be poised for a period of upward momentum. Some investors use the Golden Cross as a buying signal. While others use it as a confirmation of a stock’s strength after it has already begun to move higher.

How To Use The Golden Cross Effectively?
The golden cross can serve as an important tool when it comes to making informed trading decisions. By keeping an eye out for this pattern on your charts, you will be able to identify potential opportunities much earlier on. Rather than if you were relying solely on traditional indicators such as volume and price action.
Additionally, you can use the golden cross in combination with other technical indicators. For example, support/resistance levels or trend lines to further confirm your trading decisions. Finally, taking into account any macroeconomic factors at play (such as economic news releases). You will have even more information at your disposal. This will help you when deciding whether or not to take advantage of any potential opportunities presented by this chart pattern.
[Read More] What Happens To Stocks During A Recession?
What Else Can The Golden Cross Tell Us?
In addition to indicating possible trend changes in stocks, the golden cross can also tell us something about investor sentiment in relation to a particular stock or sector. If there is an increase in buying activity around a stock after the occurrence of a golden cross, it could indicate that investors have positive feelings toward it and expect its price to rise in the future.
On the other hand, if there isn’t much buying activity around a stock following a golden cross, it could indicate that investors are more cautious or unsure about its future prospects.
[Read More] What Stocks To Buy Today? 3 Tech Stocks For Your Watchlist
Bottom Line
The golden cross is one of many technical analysis tools available for traders and investors alike. When used correctly, it can provide valuable insight into potential market movements. As well as help you make better trading decisions by providing accurate information about where stocks might be moving next.
However, it’s important to remember that you should never rely on one single indicator exclusively. Instead, use multiple tools together (such as support/resistance levels and trend lines) along with any relevant macroeconomic news releases to make well-informed trading decisions every time.
If you enjoyed this article and you’re interested in learning how to trade so you can have the best chance to profit consistently then you need to checkout this YouTube channel. CLICK HERE RIGHT NOW!!


