If You’ve Ever Asked Yourself, “What Is RSI In Stocks?” This Is For You.
Relative Strength Index, or RSI, is a technical indicator commonly used by traders to assess whether a stock is overbought or oversold. The Relative Strength Index calculates the ratio of upward price movements to downward price movements over a given period of time and then plots that information on a scale from 0 to 100. The RSI indicator was developed by J. Welles Wilder, Jr. and introduced in his 1978 book, New Concepts in Technical Trading Systems.
How To Interpret The Relative Strength Index (RSI)?
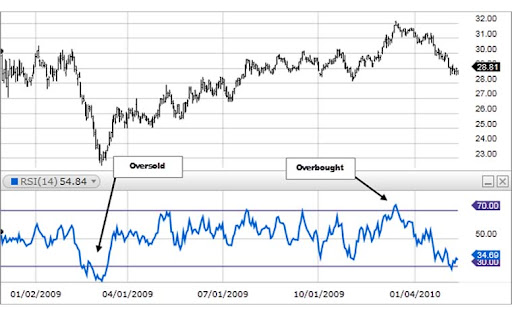
A stock is generally considered overbought when the RSI indicator reaches 70 or above and oversold when it falls below 30. However, it’s important to note that RSI is just one tool traders can use to make decisions. It should not be exclusively relied on.
Nevertheless, the Relative Strength Index can be a helpful indicator for those looking to make informed trading decisions. Here is how we would interrupt RSI in stocks within the stock market today.
Over a 14-day period RSI, the upper and bottom technical levels would be the following:
- If the RSI is equal or greater than 70, that means in theory that the stock is overbought. Also that the upward price trend is potentially set to reverse, which can result in losses in the event the trader does not sell.
- If the RSI is equal or less than 30, this means the stock is oversold. This results in a potential downward price trend reversal to the upside, which can result in generating profit if the trader buys.

What Is The Relative Strength Index (RSI) Formula?
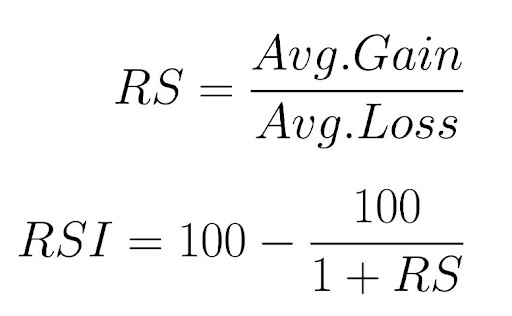
The relative Strength Index (RSI) is a technical indicator that measures momentum on a scale of 0 to 100. It helps identify whether a stock is overbought or oversold. The Relative Strength Index formula is fairly simple.

How To Calculate The Relative Strength Index (RSI)?
Now, that we know The relative strength index (RSI) is a technical momentum indicator that averages prices over a specific time period. Investors use it with price indicators because it can potentially provide higher quality stock buy or sell signals. Let’s now move into how to calculate what is RSI in stocks.
To make this RSI calculation explanation simpler, let’s first break RSI down into its most basic components: Average Gain, Average Loss, & Relative Strength (RS). The calculation uses a 14-day time frame. Losses are reported as positive values, rather than negative values.
- RS = Average Gain / Average Loss
- Relative Strength Index = 100 – 100 / (1 + RS)
- RS represents “Relative Strength”
Step 1
To calculate the RSI, you first need to calculate the Average Gain and the Average Loss. To do this, you need to look at a security’s price over a given period of time, typically 14 days. For each day in that period, you calculate the change in price from the previous day.
If the security’s price went up, you add the gain to a total gain variable. If the security’s price went down, you add the loss to a total loss variable. Once you have completed this for all 14 days, you divide the total gain by 14 and divide the total loss by 14.
Step 2
The next step is to calculate Relative Strength or also known as “RS”. To do this, you take the average gain and divide it by the average loss.
- RS = Average Gain / Average Loss
Step 3
Finally, you apply the RS value to the RSI formula to get your final answer.
- Relative Strength Index = 100 – 100 / (1 + RS)
Step 4
The resulting number will oscillate between 0 and 100. Readings 70 or higher mean the market is overbought. Next, readings coming in at 30 or below mean the market is oversold.
[Read More] Stock Market Today: Dow Jones, S&P 500 Sinks On Powell Comments; Target Stock Tumbles On Missed Earnings
Relative Strength Index (RSI) Calculation Summary
- Gather the historical values for the last 14 days.
- Calculate the price change between consecutive day prices. For example, we’d take the price on May 18th and subtract it by the price on May 17th.
- Separate the positive price changes from the negative price changes.
- Average both; the positive price changes & negative price changes.
- Calculate Relative Strength (RS) by dividing the average of positive price changes by the average of negative price changes.
- Finally, generate your RSI by subtracting 100/1(1-RS) from 100.
What Are Relative Strength Index (RSI) Divergences?
RSI Divergences are technical indicators that measure the difference between two moving averages. Also, the indicator is used to identify trend reversals and potential areas of support and resistance.
You can calculate RSI Divergences by subtracting the 26-day Exponential Moving Average (EMA), from the 12-day EMA. Moving forward, the RSI Divergences are generally bullish when the 12-day EMA is above the 26-day EMA. Vice versa, it’s generally bearish when the 12-day EMA is below the 26-day EMA.
Investors can use RSI Divergences to generate buy and sell signals. A buy signal can be generated when RSI Divergences cross above 50. A sell signal can go off when RSI Divergences cross below 50.
RSI Divergences help identify overbought and oversold conditions in the stock market. They are considered overbought when it diverges from price towards 70. On the other hand, They are oversold when it diverges from price and head towards 30.
[Read More] Best Stocks To Buy Now In 2022? 4 Dividend Stocks For Your Watchlist
What Are The Limitations Of The Relative Strength Index?
The relative strength index (RSI) is a technical indicator that measures the size and speed of recent price changes to assess overbought or oversold conditions in the market. As with all technical indicators, there are limitations to how accurate the RSI can be in predicting market movements.
One key limitation is that the RSI only considers price data from a certain period of time, typically 14 days. This means that it can take time for the indicator to reflect significant changes in market conditions.
In addition, the RSI only measures price changes, not other important factors such as volume or open interest. Furthermore, the technical indicator should be used in conjunction with other technical and fundamental analysis indicators.
Another potential limitation of the RSI is that it can generate false signals in choppy or sideways markets. In these current market conditions, prices may move up and down rapidly but not necessarily trend in one direction or the other. As a result, the indicator may give false buy or sell signals.
Despite these limitations, the RSI can be a helpful tool for identifying potential turning points in the market. However, it is always best to do your own due diligence and not just rely on just one technical indicator within your trading strategy.
Relative Strength Index (RSI) Key Takeaways
- Relative Strength Index, or RSI, is a technical indicator commonly used by traders to assess whether a stock is overbought or oversold.
- RSI’s most basic components are Average Gain, Average Loss, & Relative Strength (RS).
- The calculation uses a 14-day time frame.
- A stock is considered overbought when the RSI indicator reaches 70 or above and oversold when it drops below 30.
- RSI Divergences are technical indicators that measure the difference between two moving averages.
If you enjoyed this article and you’re interested in learning how to trade so you can have the best chance to profit consistently then you need to checkout this YouTube channel. CLICK HERE RIGHT NOW!!


